Graphics Reference
In-Depth Information
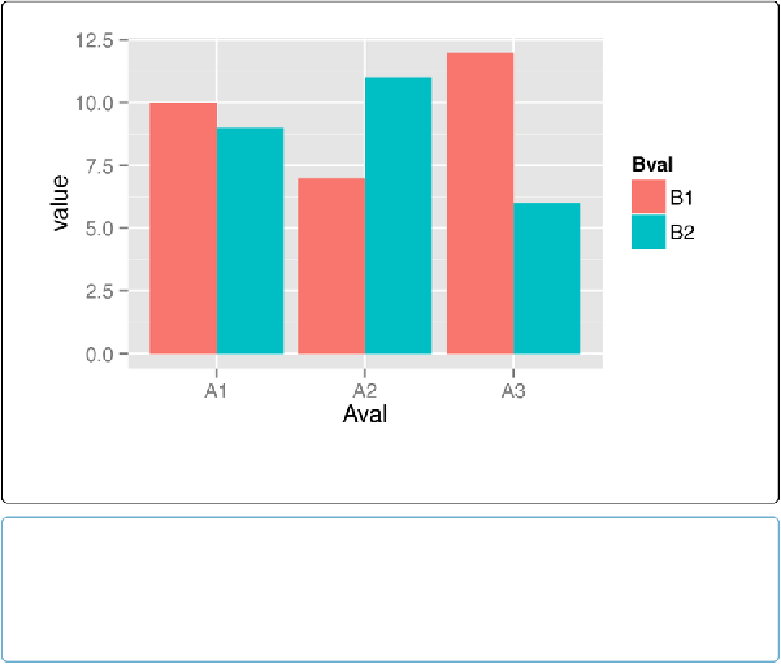
base graphics, we don't have to change the data; we just change the commands for making the
graph:
ggplot(simpledat_long, aes(x
=
Bval, y
=
value, fill
=
Aval))
+
geom_bar(stat
=
"identity"
, position
=
"dodge"
)
Figure A-5. Bar graph of the same data, but with x and fill mappings switched
NOTE
You may have noticed that with ggplot2, components of the plot are combined with the
+
operator. You
can gradually build up a ggplot object by adding components to it, then, when you're all done, you can
tell it to print.
map
Bval
to the linecolor, with
colour
, instead of the illcolour (note the British spelling—the
author of ggplot2 is a Kiwi). Again, don't worry about the other details yet:
ggplot(simpledat_long, aes(x
=
Aval, y
=
value, colour
=
Bval, group
=
Bval))
+
geom_line()