Graphics Reference
In-Depth Information
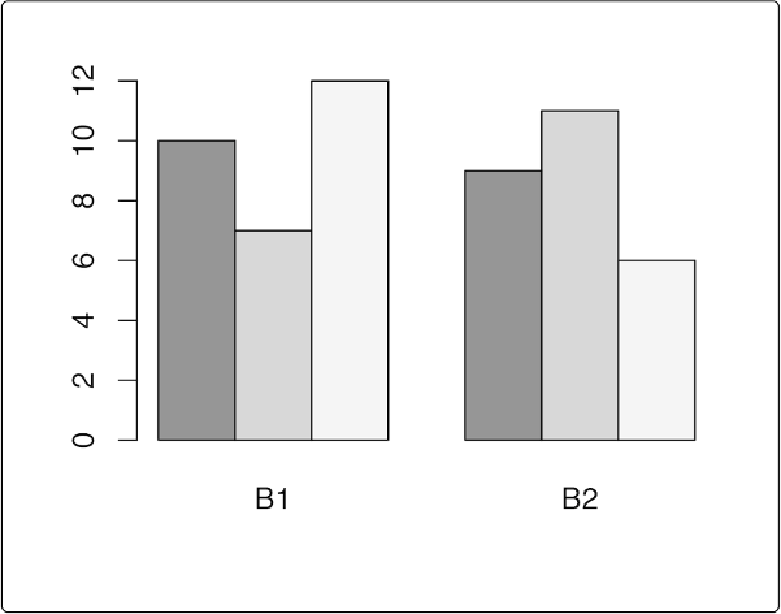
B1 B2
A1
10 9
A2
7 11
A3
12 6
With the restructured data, we can create the graph the same way as before (
Figure A-2
):
barplot(t(simpledat), beside
=
TRUE
TRUE
)
Figure A-2. A bar graph with transposed data
Another thing we might want to do is to represent the data with lines instead of bars, as shown
in
Figure A-3
.
To do this with base graphics, we need to use a completely different set of com-
mands. First we call
plot()
, which tells R to create a new graph and draw a line for one row of
data. Then we tell it to draw a second row with
lines()
:
plot(simpledat[
1
,], type
=
"l"
)
lines(simpledat[
2
,], type
=
"l"
, col
=
"blue"
)