Graphics Reference
In-Depth Information
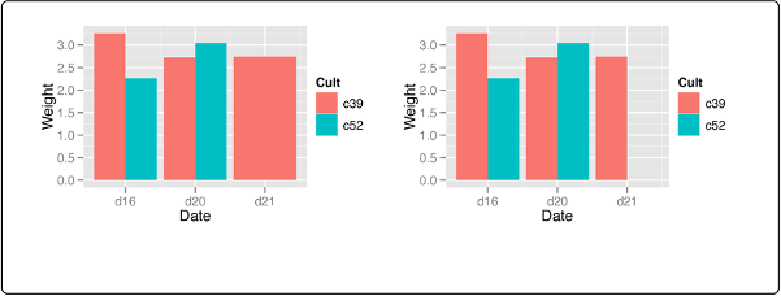
Figure 15-3. Left: bar graph with a missing combination; right: with missing combination filled
c2b
<-
ddply(c2, c(
"Cult"
,
"Date"
),
.
drop
=
FALSE
FALSE
, summarise,
Weight
=
mean(HeadWt, na.rm
=
TRUE
TRUE
),
sd
=
sd(HeadWt, na.rm
=
TRUE
TRUE
),
n
=
sum(!is.na(HeadWt)))
c2b
Cult Date Weight sd n
c39 d16
3.255556 0.9824855 9
c39 d20
2.722222 0.1394433 9
c39 d21
2.740000 0.9834181 10
c52 d16
2.260000 0.4452215 10
c52 d20
3.044444 0.8094923 9
c52 d21
NaN
NA
0
# Make the graph
ggplot(c2b, aes(x
=
Date, fill
=
Cult, y
=
Weight))
+
geom_bar(position
=
"dodge"
)
See Also
If you want to calculate standard error and confidence intervals, see
Summarizing Data with
and overlay them on a graph.
To perform transformations on data by groups, see
Transforming Variables by Group
.