Graphics Reference
In-Depth Information
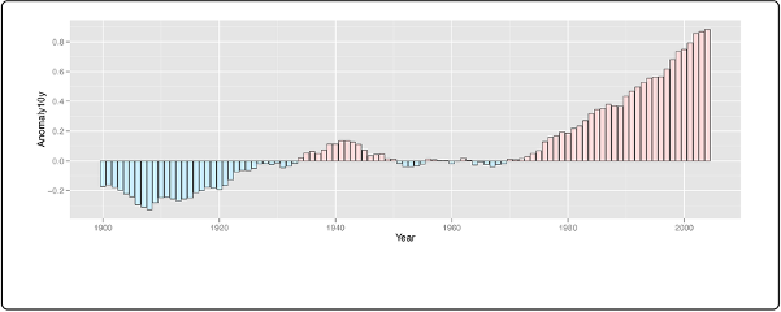
We can change the colors with
scale_fill_manual()
and remove the legend with
guide=FALSE
, as shown in
Figure 3-12
. We'll also add a thin black outline around each of the
bars by setting
colour
and specifying
size
, which is the thickness of the outline, in millimeters:
ggplot(csub, aes(x
=
Year, y
=
Anomaly10y, fill
=
pos))
+
geom_bar(stat
=
"identity"
, position
=
"identity"
, colour
=
"black"
, size
=
0.25
)
+
scale_fill_manual(values
=
c(
"#CCEEFF"
,
"#FFDDDD"
), guide
=
FALSE
FALSE
)
Figure 3-12. Graph with customized colors and no legend
See Also
To change the colors used, see Recipes and .
To hide the legend, see
Removing the Legend
.
Adjusting Bar Width and Spacing
Problem
You want to adjust the width of bars and the spacing between them.
Solution
To make the bars narrower or wider, set
width
in
geom_bar()
. The default value is 0.9; larger
values make the bars wider, and smaller values make the bars narrower (
Figure 3-13
).
For example, for standard-width bars:
library(gcookbook)
# For the data set
ggplot(pg_mean, aes(x
=
group, y
=
weight))
+
geom_bar(stat
=
"identity"
)