Graphics Reference
In-Depth Information
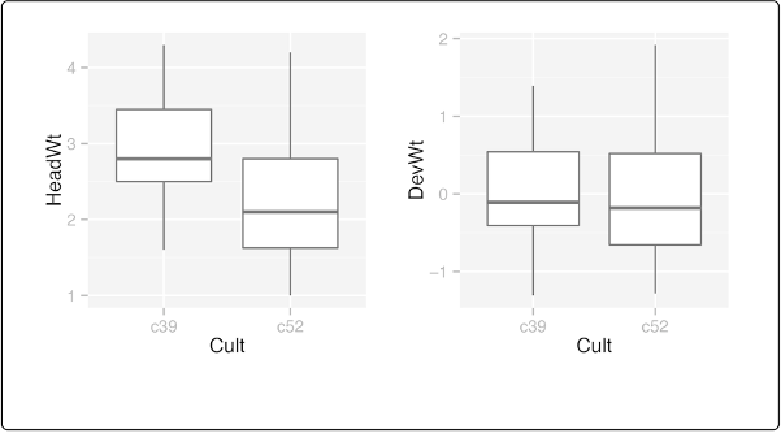
# After normalizing
ggplot(cb, aes(x
=
Cult, y
=
DevWt))
+
geom_boxplot()
Figure 15-2. Left: before normalizing; right: after normalizing
You can also split the data frame on multiple variables and perform operations on multiple vari-
ables. This will split by
Cult
and
Date
, forming a group for each unique combination of the two
variables, and then it will calculate the deviation from the mean of
HeadWt
and
VitC
within each
group:
ddply(cabbages, c(
"Cult"
,
"Date"
), transform,
DevWt
=
HeadWt
-
mean(HeadWt), DevVitC
=
VitC
-
mean(VitC))
Cult Date HeadWt VitC DevWt DevVitC
c39 d16
2.5
51 -0.68
0.7
c39 d16
2.2
55 -0.98
4.7
...
c52 d21
1.5
66 0.03
-5.8
c52 d21
1.6
72 0.13
0.2
See Also
To summarize data by groups, see
Summarizing Data by Groups
.