Graphics Reference
In-Depth Information
The
width
and
height
are in pixels, and the default is to output at 72 pixels per inch (ppi). This
resolution is suitable for displaying on a screen, but will look pixelated and jagged in print.
For high-quality print output, use at least 300 ppi.
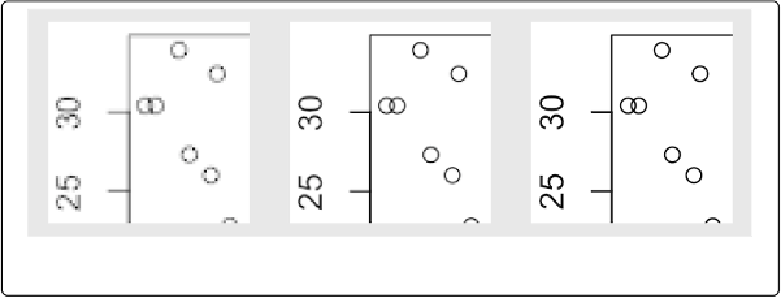
Figure 14-2
shows portions of the same plot
at different resolutions. In this example, we'll use 300 ppi and create a 4×4-inch PNG file:
ppi
<-
300
# Calculate the height and width (in pixels) for a 4x4-inch image at 300 ppi
png(
"myplot.png"
, width
=
4
*
ppi, height
=
4
*
ppi, res
=
ppi)
plot(mtcars$wt, mtcars$mpg)
dev.off()
Figure 14-2. From left to right: PNG output at 72, 150, and 300 ppi (actual size)
If you are creating plots from a script and it throws an error while creating one, R might not
reach the call to
dev.off()
, and could be left in a state where the PNG device is still open.
When this happens, the PNG file won't open properly in a viewing program until you manually
call
dev.off()
.
If you are creating a graph with ggplot2, using
ggsave()
can be a little simpler. It simply saves
the last plot created with
ggplot()
. You specify the width and height in inches, not pixels, and
tell it how many pixels per inch to use:
ggplot(mtcars, aes(x
=
wt, y
=
mpg))
+
geom_point()
# Default dimensions are in inches, but you can specify the unit
ggsave(
"myplot.png"
, width
=
8
, height
=
8
, unit
=
"cm"
, dpi
=
300
)
With
ggsave()
, you don't need to print the
ggplot
object, and if there is an error while creating
or saving the plot there's no need to manually close the graphic device.