Graphics Reference
In-Depth Information
# Generate a discrete color palette with 5 values
pal
<-
colorRampPalette(c(
"#559999"
,
"grey80"
,
"#BB650B"
))(
5
)
pal
"#559999" "#90B2B2" "#CCCCCC" "#C3986B" "#BB650B"
ggplot(crimes, aes(map_id
=
state, fill
=
Assault_q))
+
geom_map(map
=
states_map, colour
=
"black"
)
+
scale_fill_manual(values
=
pal)
+
expand_limits(x
=
states_map$long, y
=
states_map$lat)
+
coord_map(
"polyconic"
)
+
labs(fill
=
"Assault Rate\nPercentile"
)
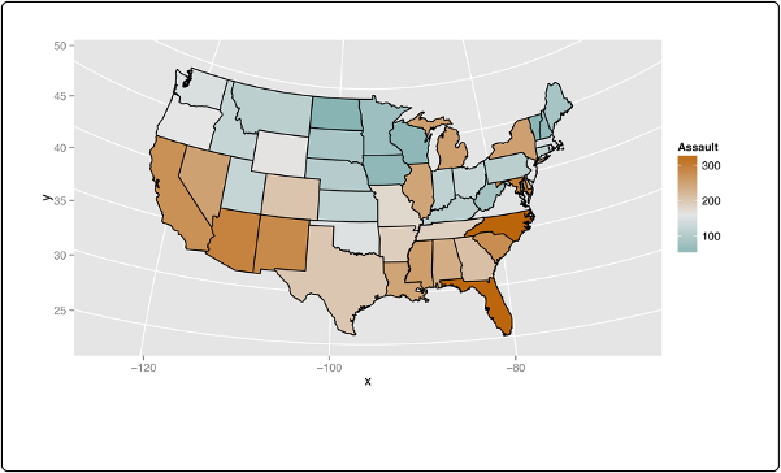
Figure 13-37. Choropleth map with discretized data
Another way to make a choropleth, but without needing to merge the map data with the value
data, is to use
geom_map()
. As of this writing, this will render maps faster than the method just
described.
For this method, the map data frame must have columns named
lat
,
long
, and
region
. In the
value data frame, there must be a column that is matched to the
region
column in the map data
frame, and this column is specified by mapping it to the
map_id
aesthetic. For example, this code
will have the same output as the first example (
Figure 13-35
):