Graphics Reference
In-Depth Information
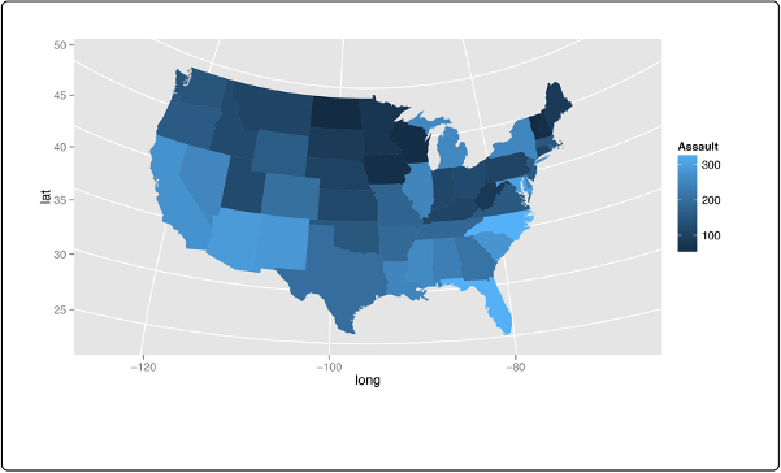
ggplot(crime_map, aes(x
=
long, y
=
lat, group
=
group, fill
=
Assault))
+
geom_polygon(colour
=
"black"
)
+
coord_map(
"polyconic"
)
Figure 13-35. A map with a variable mapped to fill
Discussion
The preceding example used the default color scale, which goes from dark to light blue.
If you want to show how the values diverge from some middle value, you can use
scale_fill_gradient2()
, as shown in
Figure 13-36
:
ggplot(crimes, aes(map_id
=
state, fill
=
Assault))
+
geom_map(map
=
states_map, colour
=
"black"
)
+
scale_fill_gradient2(low
=
"#559999"
, mid
=
"grey90"
, high
=
"#BB650B"
,
midpoint
=
median(crimes$Assault))
+
expand_limits(x
=
states_map$long, y
=
states_map$lat)
+
coord_map(
"polyconic"
)