Graphics Reference
In-Depth Information
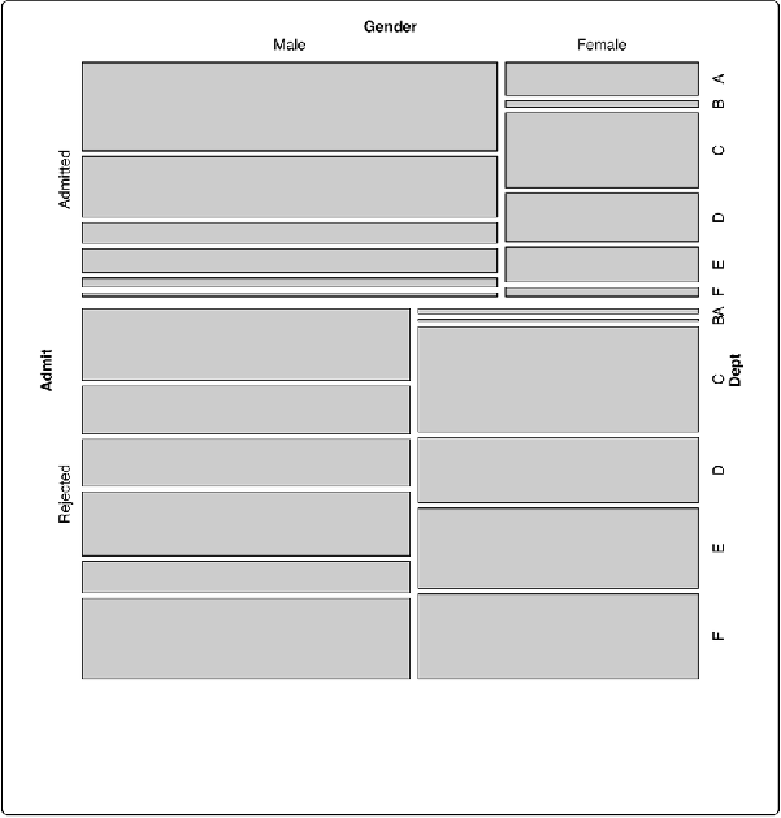
Figure 13-27. Mosaic plot of UC-Berkeley admissions data—the area of each rectangle is propor-
tional to the number of cases in that cell
Notice that
mosaic()
splits the data in the order in which the variables are provided: first on
admission status, then gender, then department. The resulting plot order makes it very clear that
more applicants were rejected than admitted. It is also clear that within the admitted group there
were many more men than women, while in the rejected group there were approximately the
same number of men and women. It is difficult to make comparisons within each department,
though. A different variable splitting order may reveal some other interesting information.