Graphics Reference
In-Depth Information
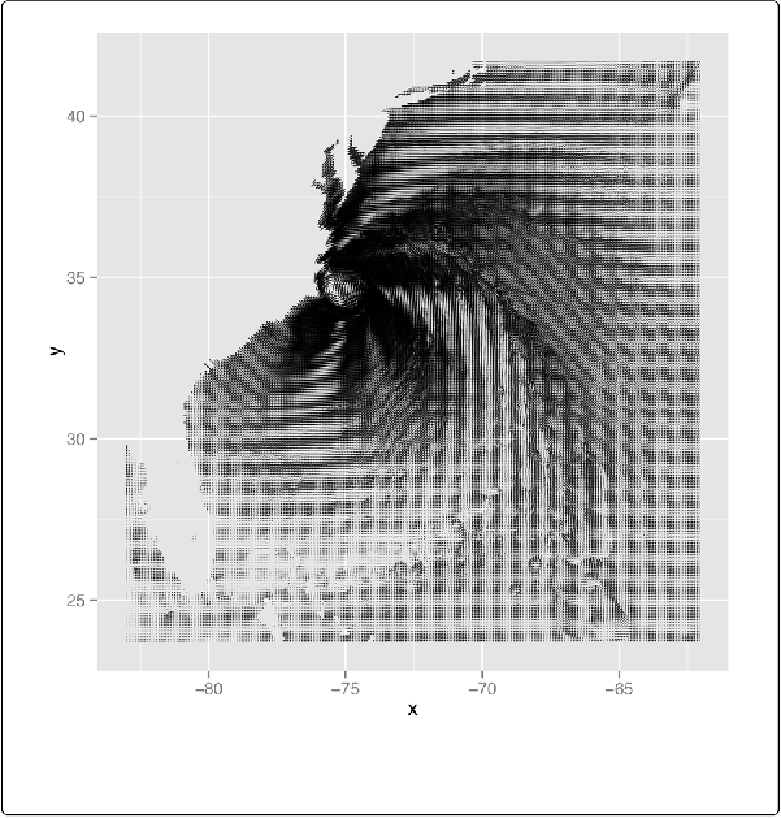
Figure 13-21. First attempt at a vector field—the resolution of the data is too high, but it does hint
at some interesting patterns not visible in graphs with a lower data resolution
This vector field has two problems: the data is at too high a resolution to read, and the segments
do not have arrows indicating the direction of the flow. To reduce the resolution of the data, we'll
define a function
every_n()
that keeps one out of every
n
values in the data and drops the rest:
# Take a slice where z is equal to the minimum value of z
islice
<-
subset(isabel, z
==
min(z))