Graphics Reference
In-Depth Information
emission
=
"grey50"
,
# emission color is grey50
xlen
=
0
, ylen
=
0
, zlen
=
0
)
# Don't add tick marks
# Set default color of future objects to black
rgl.material(color
=
"black"
)
# Add axes to specific sides. Possible values are "x--", "x-+", "x+-", and "x++".
axes3d(edges
=
c(
"x--"
,
"y+-"
,
"z--"
),
ntick
=
6
,
# Attempt 6 tick marks on each side
cex
=
.75
)
# Smaller font
# Add axis labels. 'line' specifies how far to set the label from the axis.
mtext3d(
"Weight"
, edge
=
"x--"
, line
=
2
)
mtext3d(
"Displacement"
, edge
=
"y+-"
, line
=
3
)
mtext3d(
"MPG"
,
edge
=
"z--"
, line
=
3
)
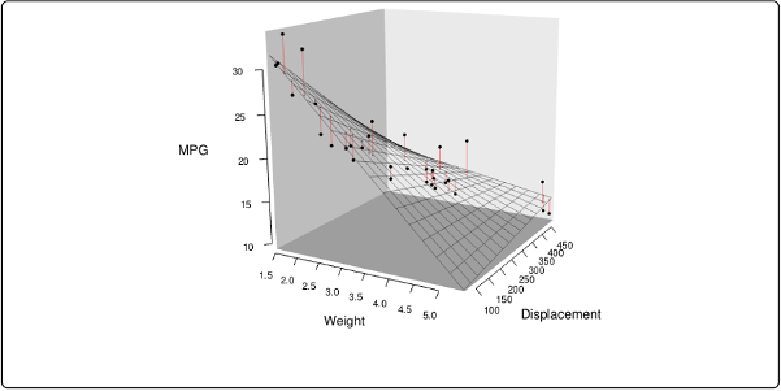
Figure 13-18. Three-dimensional scatter plot with customized appearance
See Also
For more on changing the appearance of the surface, see
?rgl.material
.
Saving a Three-Dimensional Plot
Problem
You want to save a three-dimensional plot created with the rgl package.