Graphics Reference
In-Depth Information
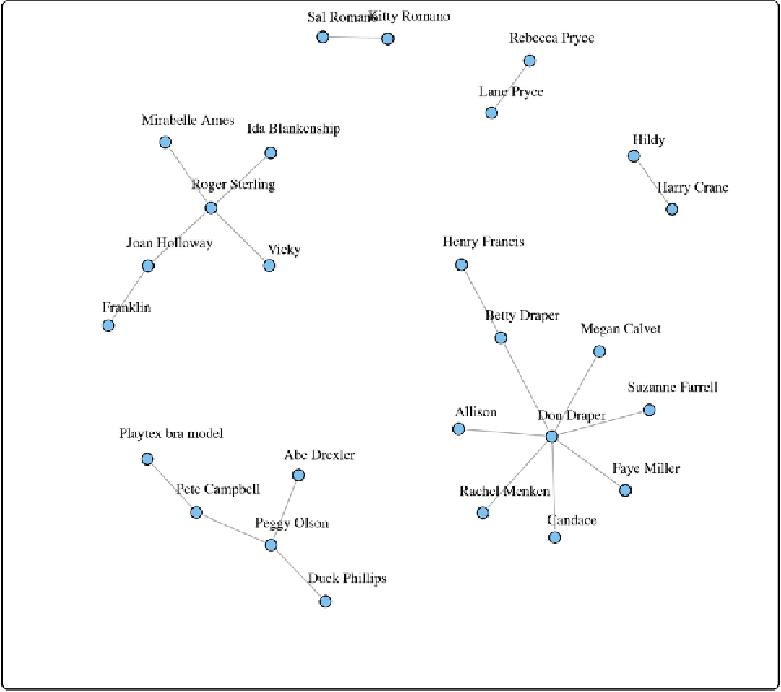
Figure 13-10. A network graph with labels
Discussion
Another way to achieve the same effect is to modify the
plot
object, instead of passing in the
values as arguments to
plot()
. To do this, use
V()$
xxx
<-
instead of passing a value to a
ver-
tex.
xxx
argument. For example, this will result in the same output as the previous code:
# This is equivalent to the preceding code
V(g)$size
<-
4
V(g)$label
<-
V(g)$name
V(g)$label.cex
<-
0.8
V(g)$label.dist
<-
0.4
V(g)$label.color
<-
"black"