Graphics Reference
In-Depth Information
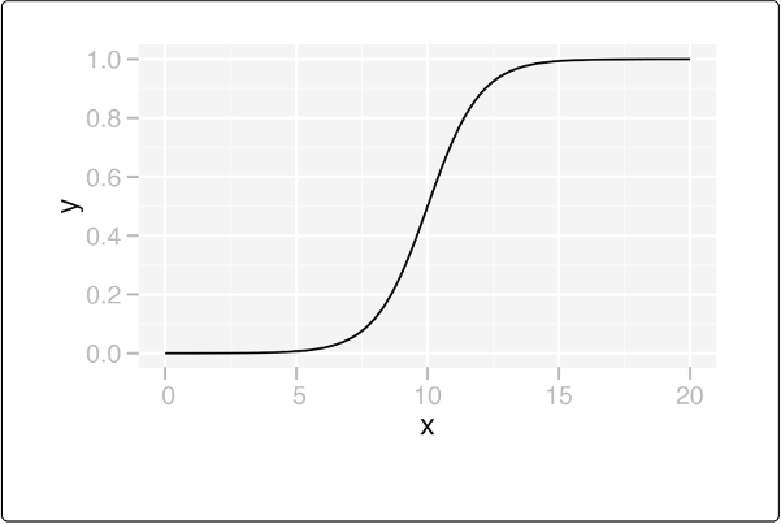
Figure 13-5. A user-defined function
By default, the function is calculated at 101 points along the xrange. If you have a rapidly fluc-
tuating function, you may be able to see the individual segments. To smooth out the curve, pass
a larger value of
n
to
stat_function()
, as in
stat_function(fun=myfun, n=200)
.
See Also
Shading a Subregion Under a Function Curve
Problem
You want to shade part of the area under a function curve.