Graphics Reference
In-Depth Information
Discussion
Changing a palette is a modification of the color (or fill) scale: it involves a change in the map-
ping from numeric or categorical values to aesthetic attributes. There are two types of scales that
use colors: illscales and colorscales.
With
scale_fill_hue()
, the colors are taken from around the color wheel in the HCL (hue-
chroma-lightness) color space. The default lightness value is 65 on a scale from 0-100. This is
good for filled areas, but it's a bit light for points and lines. To make the colors darker for points
# Basic scatter plot
h
<-
ggplot(heightweight, aes(x
=
ageYear, y
=
heightIn, colour
=
sex))
+
geom_point()
# Default lightness = 65
h
# Slightly darker
h
+
scale_colour_hue(l
=
45
)
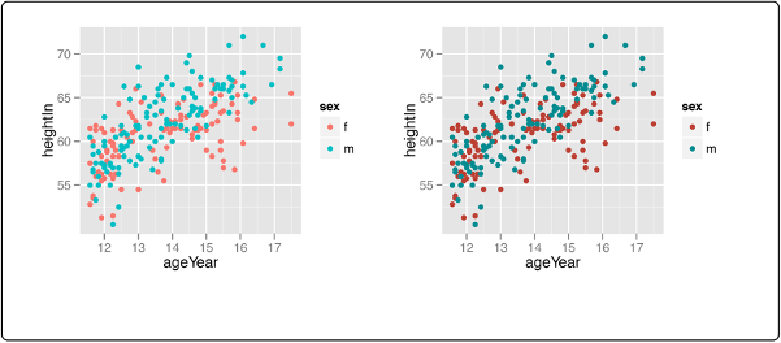
Figure 12-5. Left: points with default lightness; right: with lightness set to 45
The ColorBrewer package provides a number of palettes. You can generate a graphic showing
all of them, as shown in
Figure 12-6
:
library(RColorBrewer)
display.brewer.all()