Graphics Reference
In-Depth Information
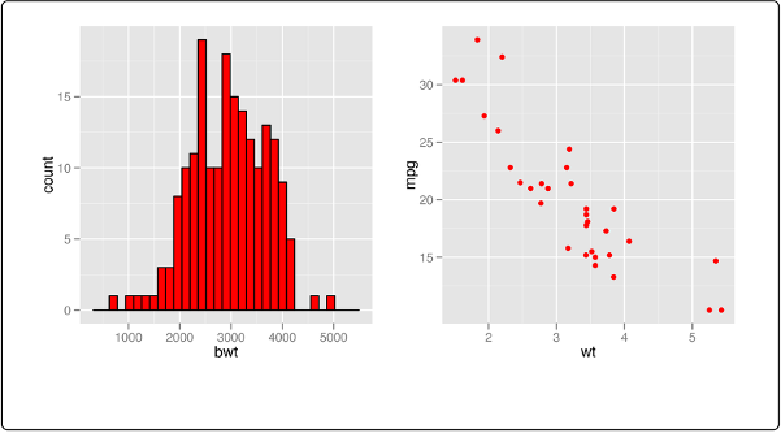
Figure 12-1. Left: setting fill and colour; right: setting colour for points
Discussion
In ggplot2, there's an important difference between settingand mappingaesthetic properties. In
the preceding example, we set the color of the objects to
"red"
.
Generally speaking,
colour
controls the color of lines and of the outlines of polygons, while
fill
controls the color of the fill area of polygons. However, point shapes are sometimes a little
different. For most point shapes, the color of the entire point is controlled by
colour
, not
fill
.
The exception is the point shapes (21-25) that have both a fill and an outline.
See Also
For more information about point shapes, see
Changing the Appearance of Points
.
See
Using a Manually Deined Palette for a Discrete Variable
for more on specifying colors.
Mapping Variables to Colors
Problem
You want to use a variable (column from a data frame) to control the color of geoms.