Graphics Reference
In-Depth Information
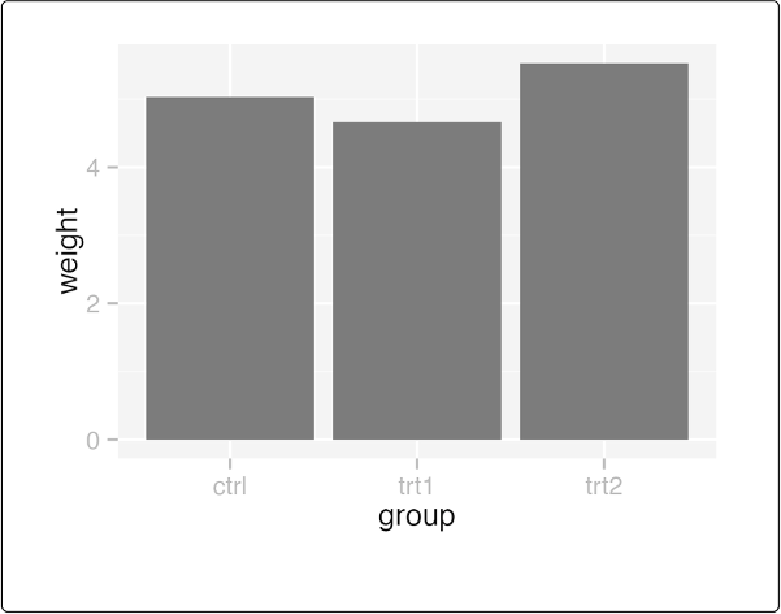
Figure 3-1. Bar graph of values (with stat="identity”) with a discrete x-axis
Discussion
When
x
is a continuous (or numeric) variable, the bars behave a little differently. Instead of hav-
ing one bar at each actual
x
value, there is one bar at each possible
x
value between the minimum
and the maximum, as in
Figure 3-2
. You can convert the continuous variable to a discrete vari-
able by using
factor()
:
# There's no entry for Time == 6
BOD
Time demand
1
8.3
2
10.3
3
19.0
4
16.0
5
15.6