Graphics Reference
In-Depth Information
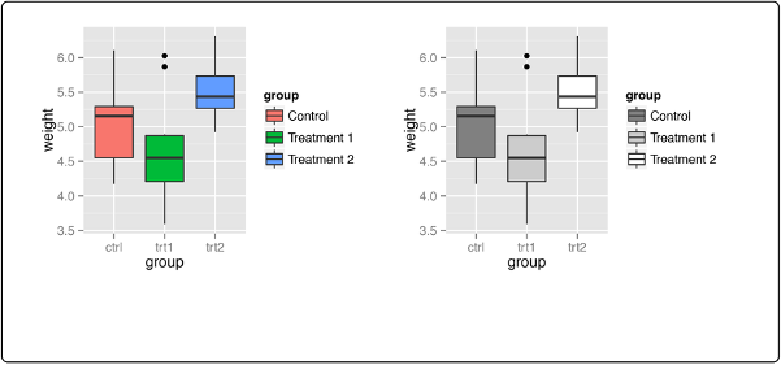
Changing the Labels in a Legend
Problem
You want to change the text of labels in a legend.
Solution
library(gcookbook)
# For the data set
# The base plot
p
<-
ggplot(PlantGrowth, aes(x
=
group, y
=
weight, fill
=
group))
+
geom_boxplot()
# Change the legend labels
p
+
scale_fill_discrete(labels
=
c(
"Control"
,
"Treatment 1"
,
"Treatment 2"
))
Figure 10-13. Left: manually specified legend labels with the default discrete scale; right: manu-
ally specified labels with a different scale
Discussion
Note that the labels on the x-axis did not change. To do that, you would have to set the
labels
ent factor level names (
Changing the Names of Factor Levels
)
.
In the preceding example,
group
was mapped to the
fill
aesthetic. By default this uses
scale_fill_discrete()
, which maps the factor levels to colors that are equally spaced around
the color wheel (the same as
scale_fill_hue()
). There are other
fill
scales we could use,