Graphics Reference
In-Depth Information
Solution
# The base plot (with legend)
p
<-
ggplot(PlantGrowth, aes(x
=
group, y
=
weight, fill
=
group))
+
geom_boxplot()
p
# Remove the legend for fill
p
+
guides(fill
=
FALSE
FALSE
)
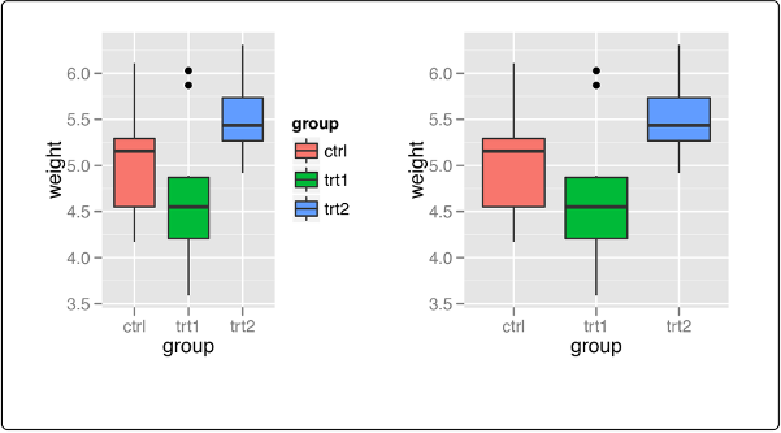
Figure 10-1. Left: default appearance; right: with legend removed
Discussion
Another way to remove a legend is to set
guide=FALSE
in the scale. This will result in the exact
same output as the preceding code:
# Remove the legend for fill
p
+
scale_fill_discrete(guide
=
FALSE
FALSE
)
Yet another way to remove the legend is to use the theming system. If you have more than one
aesthetic mapping with a legend (
color
and
shape
, for example), this will remove legends for
all of them:
p
+
theme(legend.position
=
"none"
)