Graphics Reference
In-Depth Information
}
curve(myfun(x), from
=
0
, to
=
20
)
# Add a line:
curve(
1
-
myfun(x), add
=
TRUE
TRUE
, col
=
"red"
)
stat="function"
and
geom="line"
and passing it a function that takes a numeric vector as
input and returns a numeric vector:
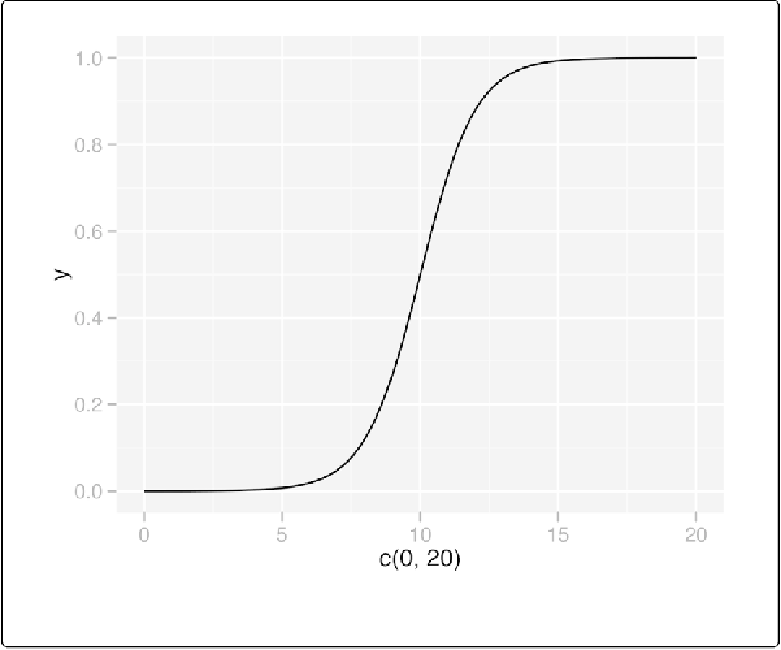
library(ggplot2)
# This sets the x range from 0 to 20
qplot(c(
0
,
20
), fun
=
myfun, stat
=
"function"
, geom
=
"line"
)
# This is equivalent to:
ggplot(data.frame(x
=
c(
0
,
20
)), aes(x
=
x))
+
stat_function(fun
=
myfun, geom
=
"line"
)
Figure 2-13. A function curve with qplot()