Graphics Reference
In-Depth Information
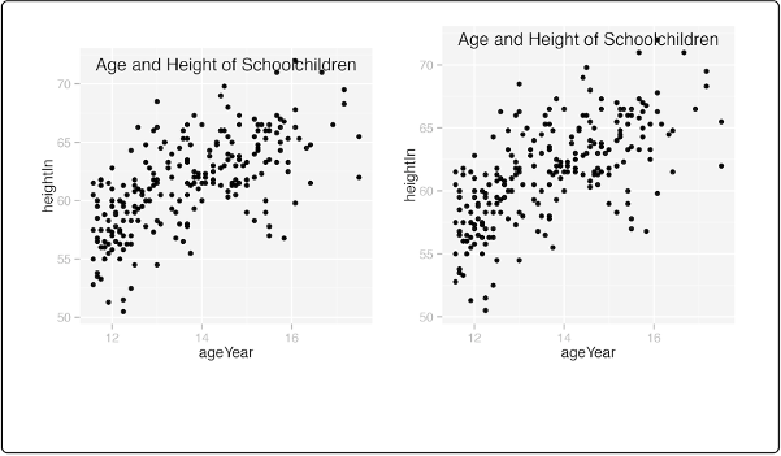
Figure 9-2. Left: title with ggtitle and a negative vjust() value (note the extra space above the plot-
ting area); right: with a text annotation at the top of the figure
The second method is to instead use a text annotation, setting its xposition to the middle of the
xrange and its yposition to
Inf
, which places it at the top of the plotting region. This also re-
quires a positive
vjust
value to bring the text fully inside the plotting region:
# Move the title inside
p
+
ggtitle(
"Age and Height of Schoolchildren"
)
+
theme(plot.title
=
element_text(vjust
=
-2.5
))
# Use a text annotation instead
p
+
annotate(
"text"
, x
=
mean(range(heightweight$ageYear)), y
=
Inf,
label
=
"Age and Height of Schoolchildren"
, vjust
=
1.5
, size
=
6
)
Changing the Appearance of Text
Problem
You want to change the appearance of text in a plot.
Solution
To set the appearance of theme items such as the title, axis labels, and axis tick marks, use
theme()
and set the item with
element_text()
. For example,
axis.title.x
controls the