Graphics Reference
In-Depth Information
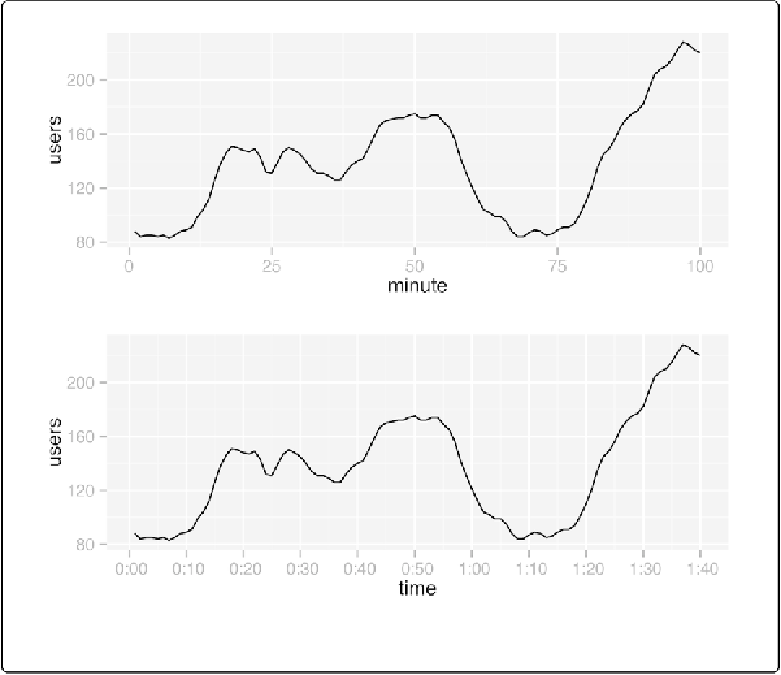
Figure 8-40. Top: relative times on x-axis; bottom: with formatted times
Discussion
In some cases it might be simpler to specify the breaks and labels manually, with something like
this:
scale_x_continuous(breaks
=
c(
0
,
20
,
40
,
60
,
80
,
100
),
labels
=
c(
"0:00"
,
"0:20"
,
"0:40"
,
"1:00"
,
"1:20"
,
"1:40"
))
In the preceding example, we used the
timeHM_formatter()
function to convert the numeric
time (in minutes) to a string like
"1:10"
: