Graphics Reference
In-Depth Information
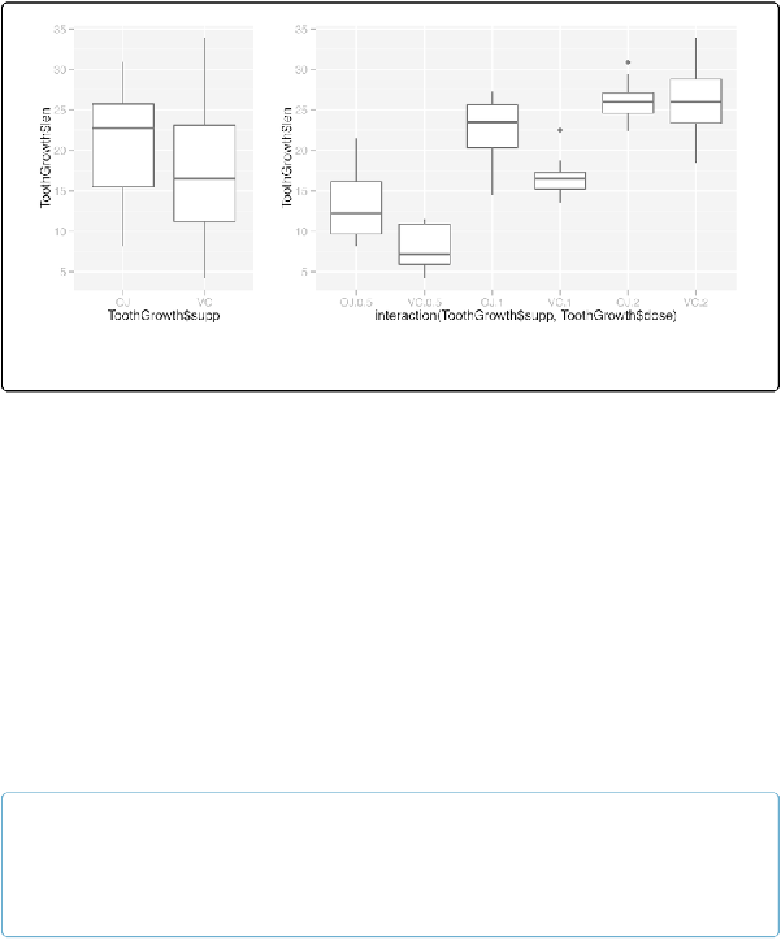
Figure 2-11. Left: box plot with qplot(); right: with multiple grouping variables
If the two vectors are already in the same data frame, you can use the following syntax:
qplot(supp, len, data
=
ToothGrowth, geom
=
"boxplot"
)
# This is equivalent to:
ggplot(ToothGrowth, aes(x
=
supp, y
=
len))
+
geom_boxplot()
It's also possible to make box plots for multiple variables, by combining the variables with
in-
it to a factor to use it as a grouping variable:
# Using three separate vectors
qplot(interaction(ToothGrowth$supp, ToothGrowth$dose), ToothGrowth$len,
geom
=
"boxplot"
)
# Alternatively, get the columns from the data frame
qplot(interaction(supp, dose), len, data
=
ToothGrowth, geom
=
"boxplot"
)
# This is equivalent to:
ggplot(ToothGrowth, aes(x
=
interaction(supp, dose), y
=
len))
+
geom_boxplot()
NOTE
You may have noticed that the box plots from base graphics are ever-so-slightly different from
those from ggplot2. This is because they use slightly different methods for calculating quantiles. See
?geom_boxplot
and
?boxplot.stats
for more information on how they differ.