Graphics Reference
In-Depth Information
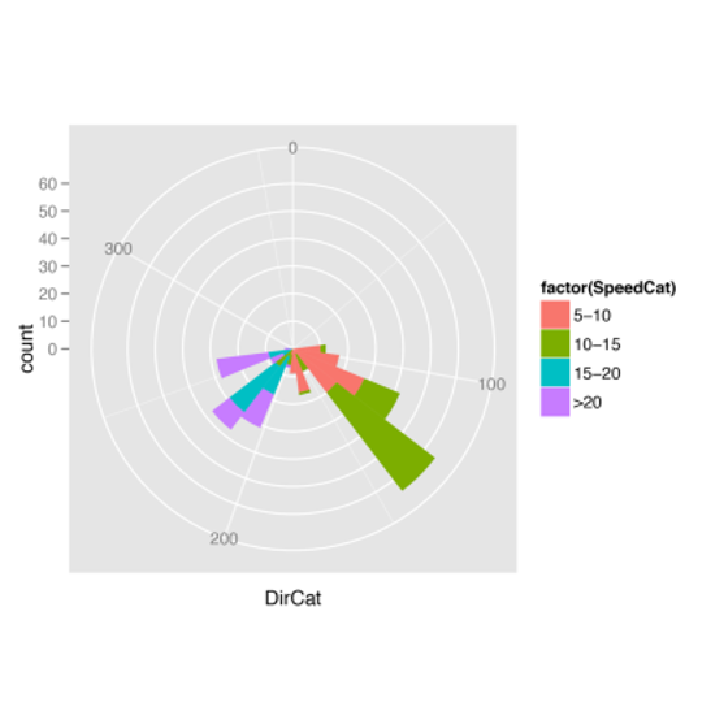
Figure 8-33. Polar plot
Discussion
Be cautious when using polar plots, since they can perceptually distort the data. In the example
here, at 210 degrees there are 15 observations with a speed of 15-20 and 13 observations with a
speed of >20, but a quick glance at the picture makes it appear that there are more observations
at >20. There are also three observations with a speed of 10-15, but they're barely visible.