Graphics Reference
In-Depth Information
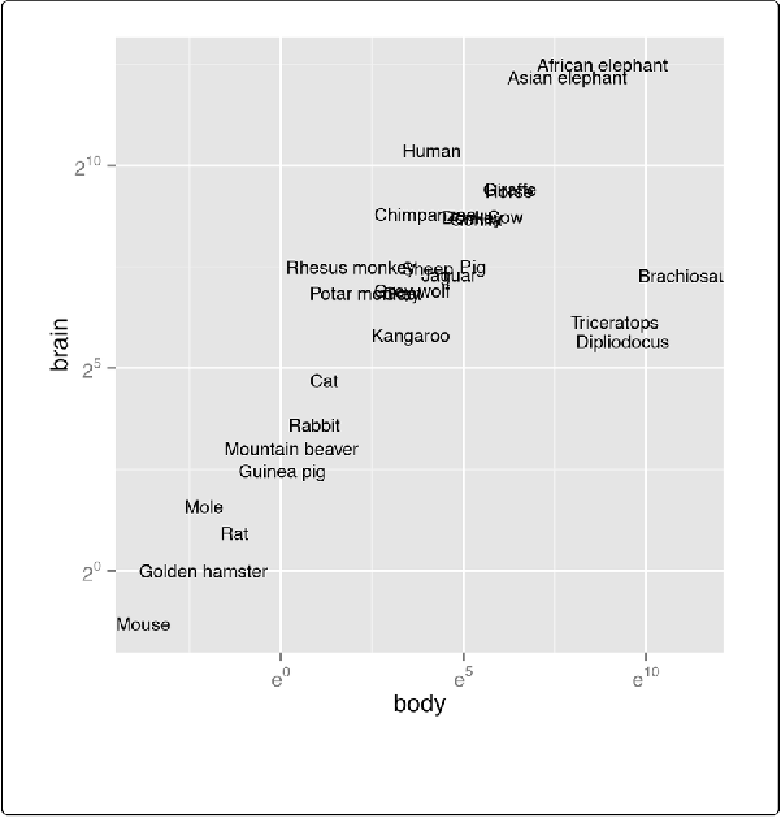
Figure 8-29. Plot with exponents in tick labels. Notice that different bases are used for the x and y
axes.
Previous Page
Next Page
R Graphics
Search WWH ::
Custom Search
Home