Graphics Reference
In-Depth Information
# With logarithmic x and y scales
p
+
scale_x_log10()
+
scale_y_log10()
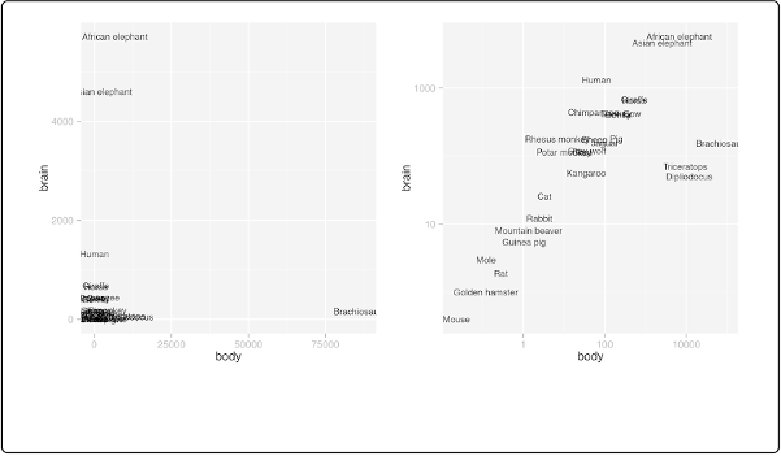
Figure 8-26. Left: exponentially distributed data with linear-scaled axes; right: with logarithmic
axes
Discussion
With a log axis, a given visual distance represents a constant proportionalchange; for example,
each centimeter on the y-axis might represent a multiplication of the quantity by 10. In contrast,
with a linear axis, a given visual distance represents a constant quantity change; each centimeter
might represent adding 10 to the quantity.
Some data sets are exponentially distributed on the x-axis, and others on the y-axis (or both). For
example, the
Animals
data set from the
MASS
library contains data on the average brain mass (in
g) and body mass (in kg) of various mammals, with a few dinosaurs thrown in for comparison:
Animals
body brain
Mountain beaver
1.350
8.1
Cow
465.000 423.0
Grey wolf
36.330 119.5
...
Brachiosaurus
87000.000 154.5