Graphics Reference
In-Depth Information
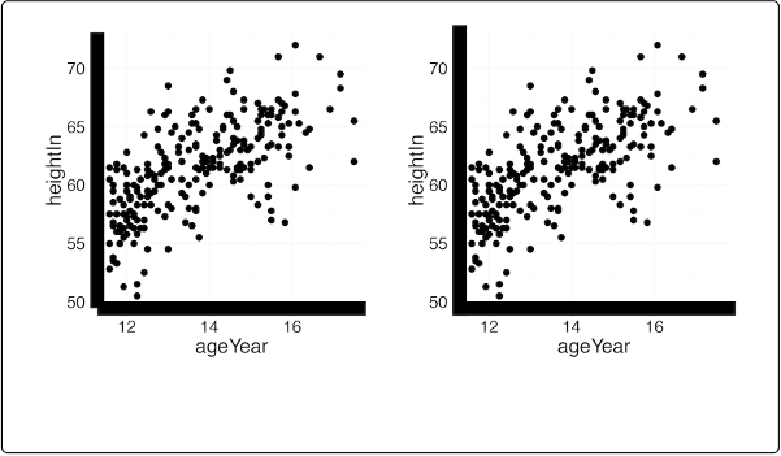
Figure 8-25. Left: with thick lines, the ends don't fully overlap; right: full overlap with lin-
eend="square"
See Also
For more information about how the theming system works, see
Using Themes
.
Using a Logarithmic Axis
Problem
You want to use a logarithmic axis for a graph.
Solution
library(MASS)
# For the data set
# The base plot
p
<-
ggplot(Animals, aes(x
=
body, y
=
brain, label
=
rownames(Animals)))
+
geom_text(size
=
3
)
p

