Graphics Reference
In-Depth Information
seq(
4
,
7
, by
=
.5
)
4.0 4.5 5.0 5.5 6.0 6.5 7.0
5
:
10
5 6 7 8 9 10
If the axis is discrete instead of continuous, then there is by default a tick mark for each item.
For discrete axes, you can change the order of items or remove them by specifying the limits
the levels are labeled, but will not remove them or change their order.
Figure 8-13
shows what
happens when you set
limits
and
breaks
:
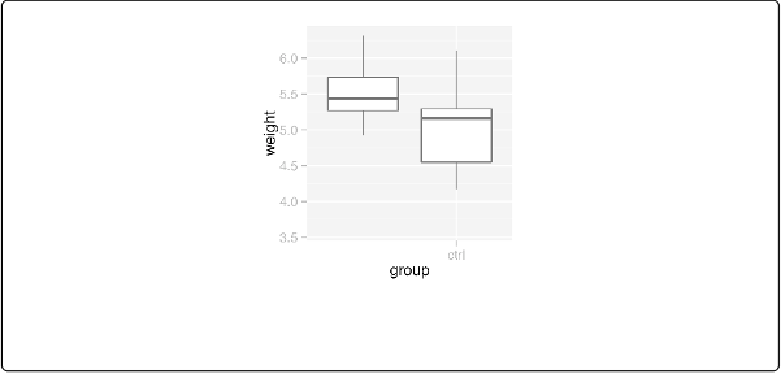
# Set both breaks and labels for a discrete axis
ggplot(PlantGrowth, aes(x
=
group, y
=
weight))
+
geom_boxplot()
+
scale_x_discrete(limits
=
c(
"trt2"
,
"ctrl"
), breaks
=
"ctrl"
)
Figure 8-13. For a discrete axis, setting limits reorders and removes items, and setting breaks con-
trols which items have labels
See Also
To remove the tick marks and labels (but not the data) from the graph, see
Removing Tick Marks