Graphics Reference
In-Depth Information
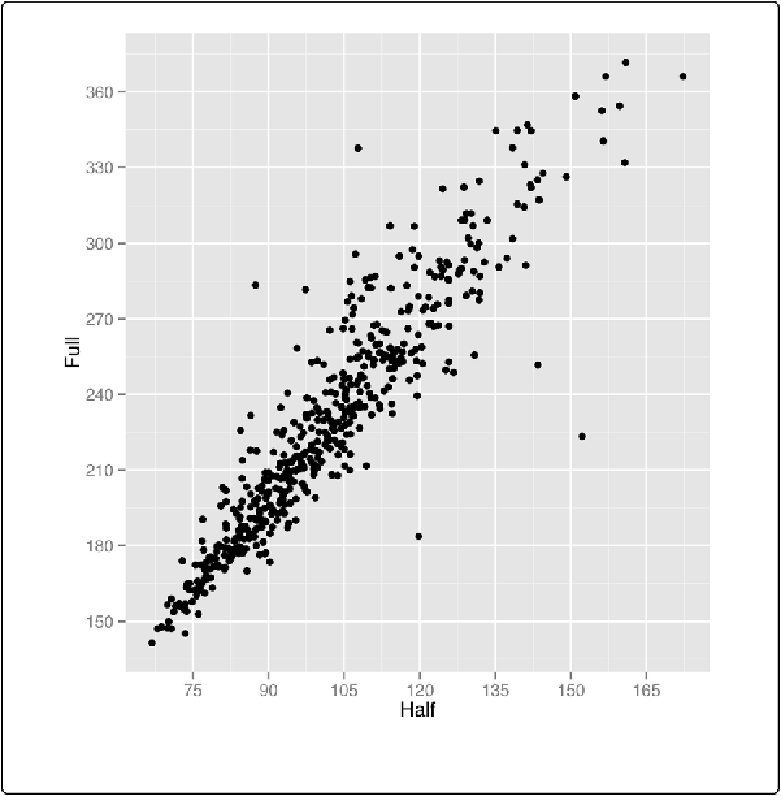
out to twice that of the axis with the marathon times (
Figure 8-11
). We'll also add tick marks
twice as often on the x-axis:
sp
+
coord_fixed(ratio
=
1
/
2
)
+
scale_y_continuous(breaks
=
seq(
0
,
420
,
30
))
+
scale_x_continuous(breaks
=
seq(
0
,
420
,
15
))
Figure 8-11. Scatter plot with a 1/2 scaling ratio for the axes