Graphics Reference
In-Depth Information
Solution
For a categorical (or discrete) axis—one with a factor mapped to it—the order of items can be
changed by setting
limits
in
scale_x_discrete()
or
scale_y_discrete()
.
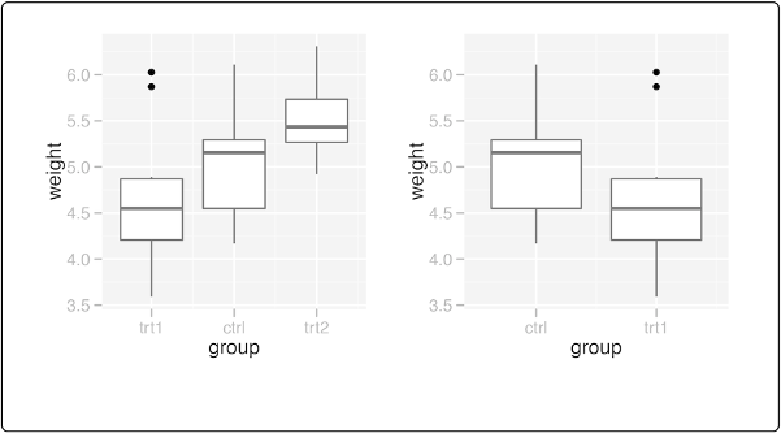
To manually set the order of items on the axis, specify
limits
with a vector of the levels in the
desired order. You can also omit items with this vector, as shown in
Figure 8-8
:
p
<-
ggplot(PlantGrowth, aes(x
=
group, y
=
weight))
+
geom_boxplot()
p
+
scale_x_discrete(limits
=
c(
"trt1"
,
"ctrl"
,
"trt2"
))
Figure 8-8. Left: box plot with manually specified items on the x-axis; right: with only two items
Discussion
You can also use this method to display a subset of the items on the axis. This will show only
p
+
scale_x_discrete(limits
=
c(
"ctrl"
,
"trt1"
))
To reverse the order, set
limits=rev(levels(...))
, and put the factor inside. This will re-
p
+
scale_x_discrete(limits
=
rev(levels(PlantGrowth$group)))