Graphics Reference
In-Depth Information
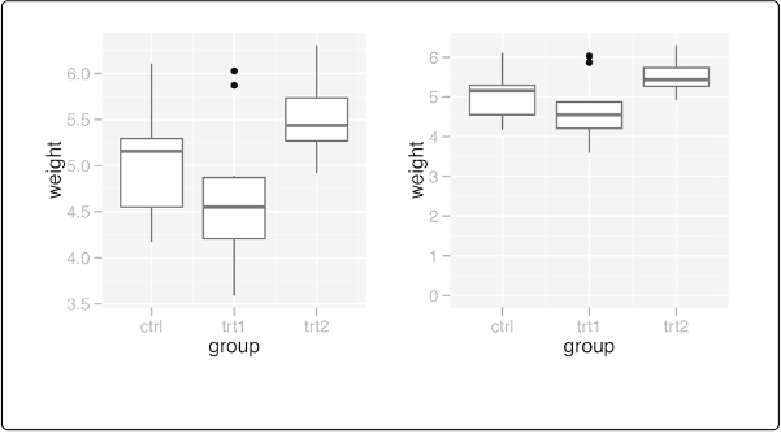
Figure 8-3. Left: box plot with default range; right: with manually set range
The latter example sets the yrange from 0 to the maximum value of the
weight
column, though
a constant value (like 10) could instead be used as the maximum.
Discussion
ylim()
is shorthand for setting the limits with
scale_y_continuous()
. (The same is true for
xlim()
and
scale_x_continuous()
.) The following are equivalent:
ylim(
0
,
10
)
scale_y_continuous(limits
=
c(
0
,
10
))
Sometimes you will need to set other properties of
scale_y_continuous()
, and in these cases
using
xlim()
and
scale_y_continuous()
together may result in some unexpected behavior,
because only the first of the directives will have an effect. In these two examples,
ylim(0, 10)
should set the yrange from 0 to 10, and
scale_y_continuous(breaks=c(0, 5, 10))
should
put tick marks at 0, 5, and 10. However, in both cases, only the second directive has any effect:
p
+
ylim(
0
,
10
)
+
scale_y_continuous(breaks
=
NULL
NULL
)
p
+
scale_y_continuous(breaks
=
NULL
NULL
)
+
ylim(
0
,
10
)
To make both changes work, get rid of
ylim()
and set both
limits
and
breaks
in
scale_y_continuous()
:
p
+
scale_y_continuous(limits
=
c(
0
,
10
), breaks
=
NULL
NULL
)