Graphics Reference
In-Depth Information
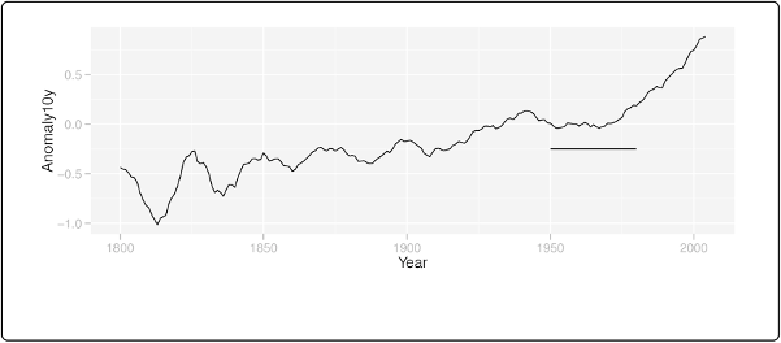
Adding Line Segments and Arrows
Problem
You want to add line segments or arrows to a plot.
Solution
Use
annotate("segment")
. In this example, we'll use the
climate
data set and use a subset
of data from the Berkeley source (
Figure 7-10
):
library(gcookbook)
# For the data set
p
<-
ggplot(subset(climate, Source
==
"Berkeley"
), aes(x
=
Year, y
=
Anomaly10y))
+
geom_line()
p
+
annotate(
"segment"
, x
=
1950
, xend
=
1980
, y
=-
.25
, yend
=-
.25
)
Figure 7-10. Line segment annotation
Discussion
It's possible to add arrowheads or flat ends to the line segments, using
arrow()
from the grid
package. In this example, we'll do both (
Figure 7-11
):
library(grid)
p
+
annotate(
"segment"
, x
=
1850
, xend
=
1820
, y
=-
.8
, yend
=-
.95
, colour
=
"blue"
,
size
=
2
, arrow
=
arrow())
+
annotate(
"segment"
, x
=
1950
, xend
=
1980
, y
=-
.25
, yend
=-
.25
,
arrow
=
arrow(ends
=
"both"
, angle
=
90
, length
=
unit(
.2
,
"cm"
)))