Graphics Reference
In-Depth Information
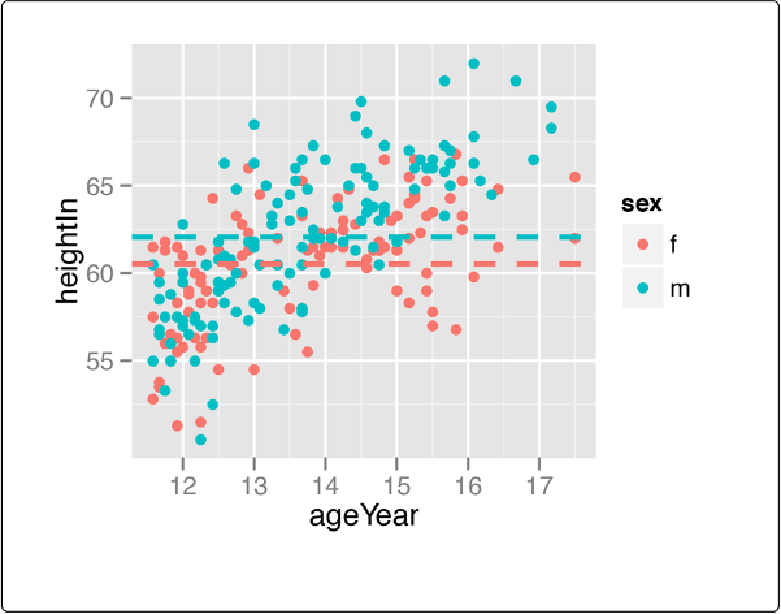
Here we'll take the average height for males and females and store it in a data frame,
hw_means
.
library(plyr)
# For the ddply() function
hw_means
<-
ddply(heightweight,
"sex"
, summarise, heightIn
=
mean(heightIn))
hw_means
sex heightIn
f
60.52613
m
62.06000
p
+
geom_hline(aes(yintercept
=
heightIn, colour
=
sex), data
=
hw_means,
linetype
=
"dashed"
, size
=
1
)
Figure 7-8. Multiple lines, drawn at the mean of each group
If one of the axes is discrete rather than continuous, you can't specify the intercepts as just a
character string—they must still be specified as numbers. If the axis represents a factor, the first