Graphics Reference
In-Depth Information
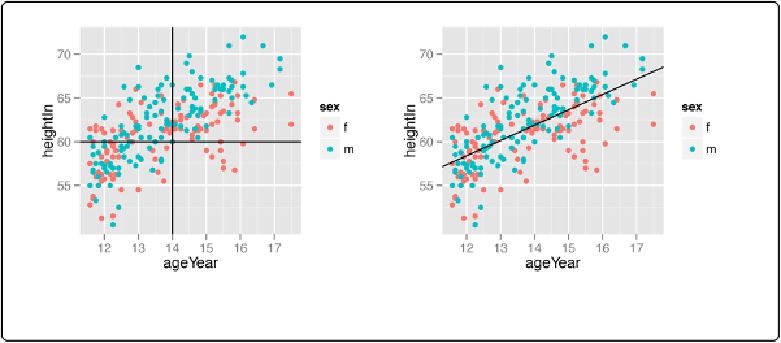
Adding Lines
Problem
You want to add lines to a plot.
Solution
For horizontal and vertical lines, use
geom_hline()
and
geom_vline()
, and for angled lines,
library(gcookbook)
# For the data set
p
<-
ggplot(heightweight, aes(x
=
ageYear, y
=
heightIn, colour
=
sex))
+
geom_point()
# Add horizontal and vertical lines
p
+
geom_hline(yintercept
=
60
)
+
geom_vline(xintercept
=
14
)
# Add angled line
p
+
geom_abline(intercept
=
37.4
, slope
=
1.75
)
Figure 7-7. Left: horizontal and vertical lines; right: angled line
Discussion
The previous examples demonstrate setting the positions of the lines manually, resulting in one
line drawn for each geom added. It is also possible to mapvalues from the data to
xintercept
,
yintercept
, and so on, and even draw them from another data frame.