Graphics Reference
In-Depth Information
p
+
annotate(
"text"
, x
=
0
, y
=
0.05
, parse
=
TRUE
TRUE
, size
=
4
,
label
=
"'Function: ' * y==frac(1, sqrt(2*pi)) * e^{-x^2/2}"
)
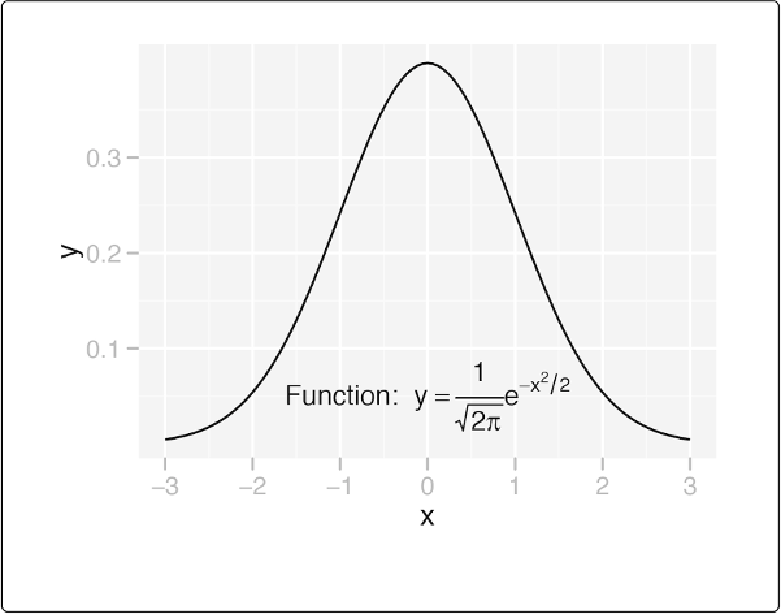
Figure 7-6. Mathematical expression with regular text
See Also
See
?plotmath
for many examples of mathematical expressions, and
?demo(plotmath)
for
graphical examples of mathematical expressions.
See
Adding Annotations with Model Coeicients
for adding regression coefficients to a graph.
For using other fonts in mathematical expressions, see
Using Fonts in PDF Files
.