Graphics Reference
In-Depth Information
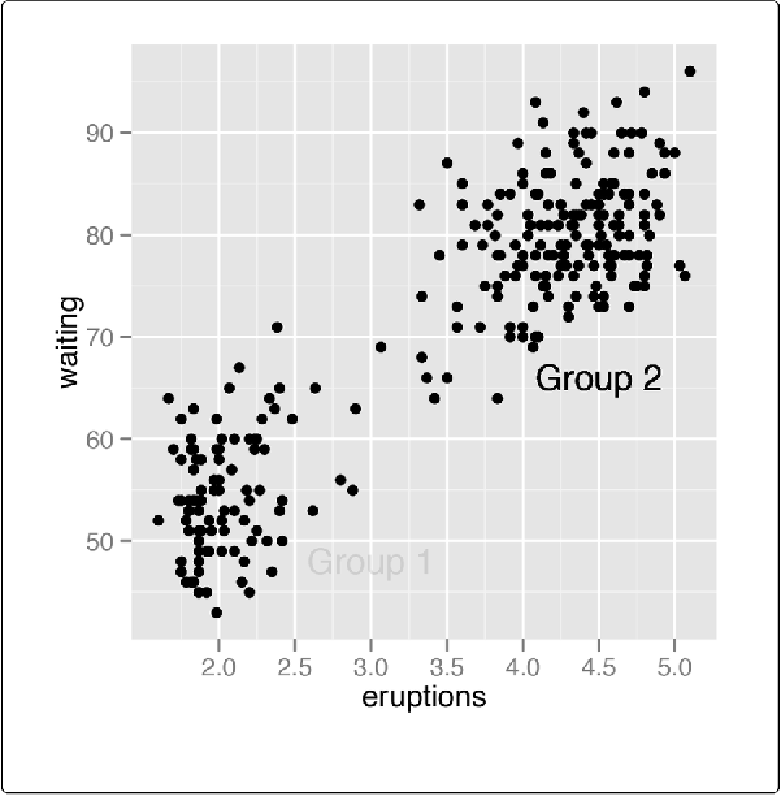
Figure 7-3. Overplotting one of the labels—both should be 90% transparent
If the axes are continuous, you can use the special values
Inf
and
-Inf
to place text annotations
at the edge of the plotting area, as shown in
Figure 7-4
.
You will also need to adjust the position
of the text relative to the corner using
hjust
and
vjust
—if you leave them at their default val-
ues, the text will be centered on the edge. It may take a little experimentation with these values
to get the text positioned to your liking: