Graphics Reference
In-Depth Information
p
+
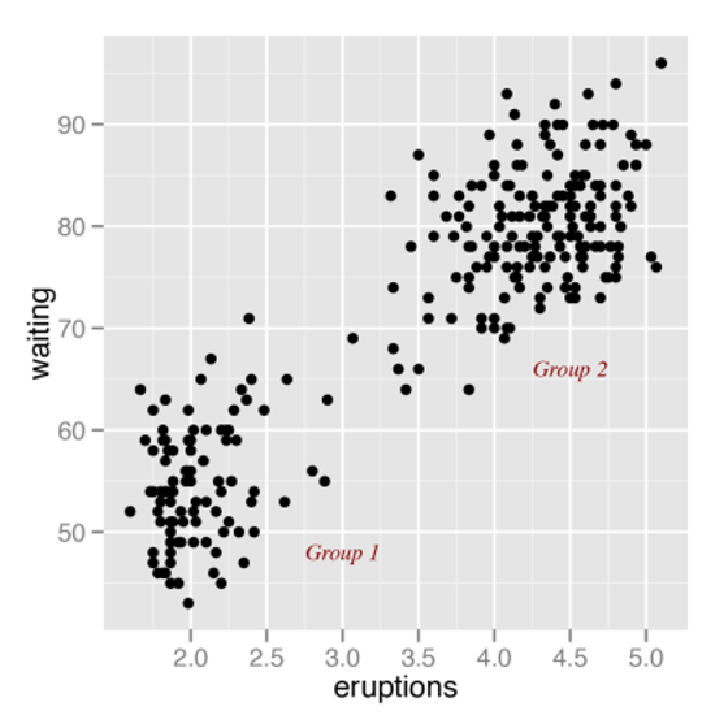
annotate(
"text"
, x
=
3
, y
=
48
, label
=
"Group 1"
, family
=
"serif"
,
fontface
=
"italic"
, colour
=
"darkred"
, size
=
3
)
+
annotate(
"text"
, x
=
4.5
, y
=
66
, label
=
"Group 2"
, family
=
"serif"
,
fontface
=
"italic"
, colour
=
"darkred"
, size
=
3
)
Figure 7-2. Modified text properties
Be careful not to use
geom_text()
when you want to add individual text objects. While
annot-
ate(geom="text")
will add a single text object to the plot,
geom_text()
will create many text
objects based on the data, as discussed in
Labeling Points in a Scatter Plot
.