Graphics Reference
In-Depth Information
lines(pressure$temperature, pressure$pressure
/
2
, col
=
"red"
)
points(pressure$temperature, pressure$pressure
/
2
, col
=
"red"
)
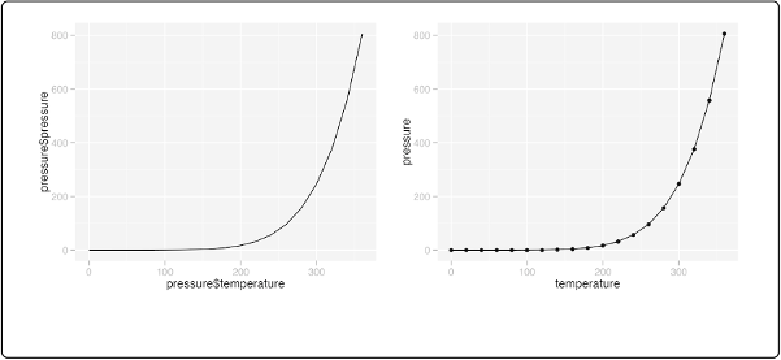
library(ggplot2)
qplot(pressure$temperature, pressure$pressure, geom
=
"line"
)
Figure 2-4. Left: line graph with qplot() from ggplot2; right: with points added
If the two vectors are already in the same data frame, you can use the following syntax:
qplot(temperature, pressure, data
=
pressure, geom
=
"line"
)
# This is equivalent to:
ggplot(pressure, aes(x
=
temperature, y
=
pressure))
+
geom_line()
# Lines and points together
qplot(temperature, pressure, data
=
pressure, geom
=
c(
"line"
,
"point"
))
# Equivalent to:
ggplot(pressure, aes(x
=
temperature, y
=
pressure))
+
geom_line()
+
geom_point()
See Also
See
Chapter 4
for more in-depth information about creating line graphs.