Graphics Reference
In-Depth Information
p
+
geom_point()
+
stat_density2d()
It's also possible to map the heightof the density curve to the color of the contour lines, by using
..level..
(
Figure 6-33
, right):
# Contour lines, with "height" mapped to color
p
+
stat_density2d(aes(colour
=
..
level..))
Figure 6-33. Left: points and density contour; right: with ..level.. mapped to color
Discussion
The two-dimensional kernel density estimate is analogous to the one-dimensional density estim-
ate generated by
stat_density()
, but of course, it needs to be viewed in a different way. The
default is to use contour lines, but it's also possible to use tiles and map the density estimate to
the fill color, or to the transparency of the tiles, as shown in
Figure 6-34
:
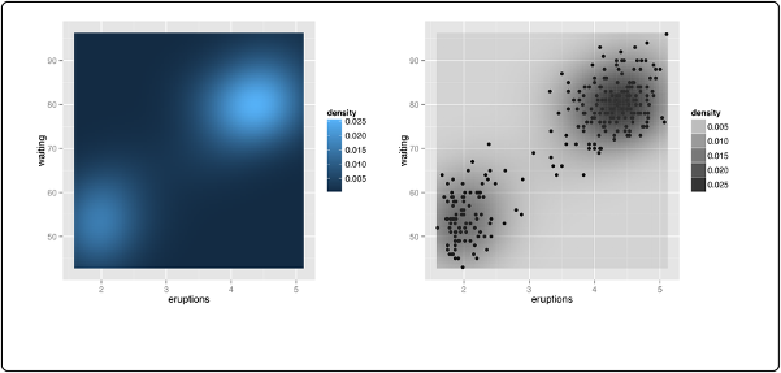
# Map density estimate to fill color
p
+
stat_density2d(aes(fill
=
..
density..), geom
=
"raster"
, contour
=
FALSE
FALSE
)
# With points, and map density estimate to alpha
p
+
geom_point()
+
stat_density2d(aes(alpha
=
..
density..), geom
=
"tile"
, contour
=
FALSE
FALSE
)