Graphics Reference
In-Depth Information
is treated as numeric you must also specify the
group
, or else the data will be treated as a
single group, with just one box plot and dot plot. Finally, since the x-axis is treated as nu-
meric, it will by default show numbers for the x-axis tick labels; they must be modified with
scale_x_continuous()
to show xtick labels as text corresponding to the factor levels:
ggplot(heightweight, aes(x
=
sex, y
=
heightIn))
+
geom_boxplot(aes(x
=
as.numeric(sex)
+
.2
, group
=
sex), width
=
.25
)
+
geom_dotplot(aes(x
=
as.numeric(sex)
-
.2
, group
=
sex), binaxis
=
"y"
,
binwidth
=
.5
, stackdir
=
"center"
)
+
scale_x_continuous(breaks
=
1
:nlevels(heightweight$sex),
labels
=
levels(heightweight$sex))
Figure 6-32. Dot plot next to box plot
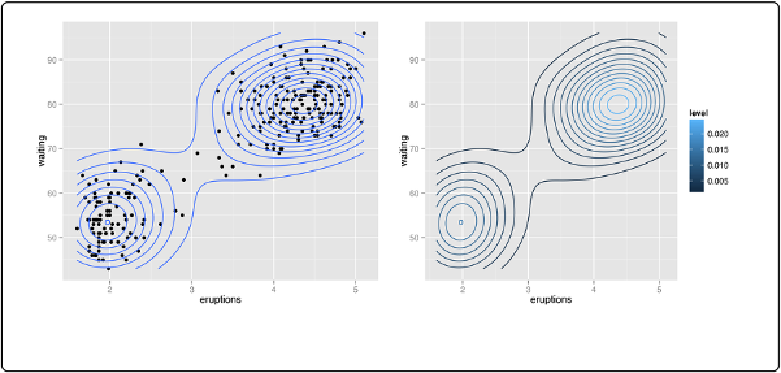
Making a Density Plot of Two-Dimensional Data
Problem
You want to plot the density of two-dimensional (2D) data.
Solution
Use
stat_density2d()
. This makes a 2D kernel density estimate from the data. First we'll plot
the density contour along with the data points (
Figure 6-33
, left):
# The base plot
p
<-
ggplot(faithful, aes(x
=
eruptions, y
=
waiting))