Graphics Reference
In-Depth Information
See Also
See
Chapter 5
for more in-depth information about creating scatter plots.
Creating a Line Graph
Problem
You want to create a line graph.
Solution
yvalues, and use
type="l"
:
plot(pressure$temperature, pressure$pressure, type="l")
=
"l"
)
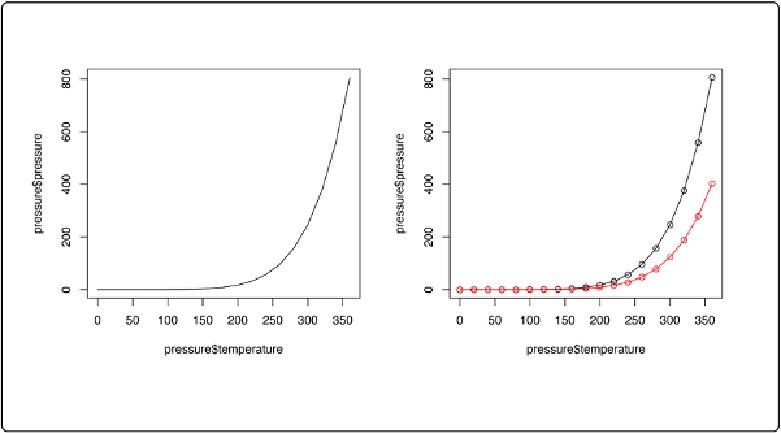
Figure 2-3. Left: line graph with base graphics; right: with points and another line
To add points and/or multiple lines (
Figure 2-3
, right), first call
plot()
for the first line, then
add points with
points()
and additional lines with
lines()
:
plot(pressure$temperature, pressure$pressure, type="l")
=
"l"
)
points(pressure$temperature, pressure$pressure)