Graphics Reference
In-Depth Information
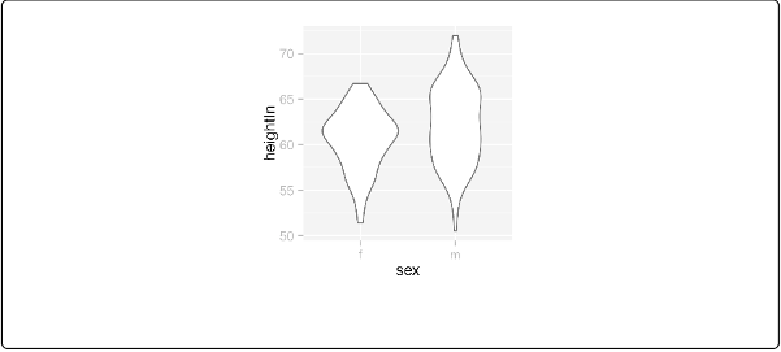
scale="count"
to scale the areas proportionally to the number of observations in each group
slightly narrower:
# Scaled area proportional to number of observations
p
+
geom_violin(scale
=
"count"
)
Figure 6-24. Violin plot with area proportional to number of observations
ity Curve
. The default value is 1; use larger values for more smoothing and smaller values for
less smoothing (
Figure 6-25
):
# More smoothing
p
+
geom_violin(adjust
=
2
)
# Less smoothing
p
+
geom_violin(adjust
=
.5
)