Graphics Reference
In-Depth Information
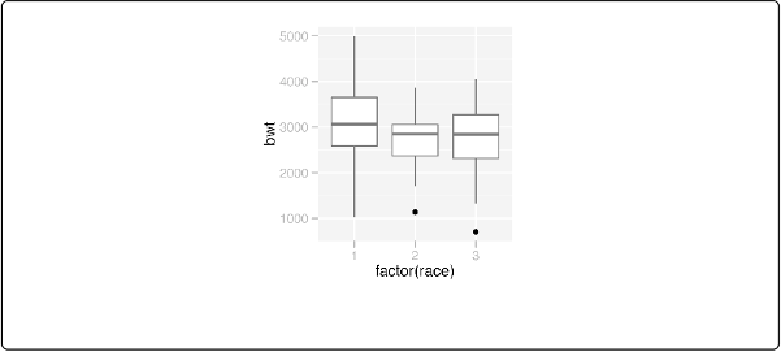
Solution
library(MASS)
# For the data set
ggplot(birthwt, aes(x
=
factor(race), y
=
bwt))
+
geom_boxplot()
# Use factor() to convert numeric variable to discrete
Figure 6-15. A box plot
Discussion
For this example, we used the
birthwt
data set from the
MASS
library. It contains data about
birth weights and a number of risk factors for low birth weight:
birthwt
low age lwt race smoke ptl ht ui ftv bwt
0 19 182
2
0
0 0 1
0 2523
0 33 155
3
0
0 0 0
3 2551
0 20 105
1
1
0 0 0
1 2557
...
bwt
for each group. The value of
race
is 1, 2, or 3, but since it's stored as a numeric vector,
ggplot()
doesn't know how to use it as a grouping variable. To make this work, we can
modify the data frame by converting
race
to a factor, or tell
ggplot()
to treat it as a factor