Graphics Reference
In-Depth Information
Solution
Use
geom_density()
, and map the grouping variable to an aesthetic like
colour
or
fill
, as
shown in
Figure 6-11
. The grouping variable must be a factor or character vector. In the
birth-
wt
data set, the desired grouping variable,
smoke
, is stored as a number, so we have to convert it
to a factor first:
library(MASS)
# For the data set
# Make a copy of the data
birthwt1
<-
birthwt
# Convert smoke to a factor
birthwt1$smoke
<-
factor(birthwt1$smoke)
# Map smoke to colour
ggplot(birthwt1, aes(x
=
bwt, colour
=
smoke))
+
geom_density()
# Map smoke to fill and make the fill semitransparent by setting alpha
ggplot(birthwt1, aes(x
=
bwt, fill
=
smoke))
+
geom_density(alpha
=
.3
)
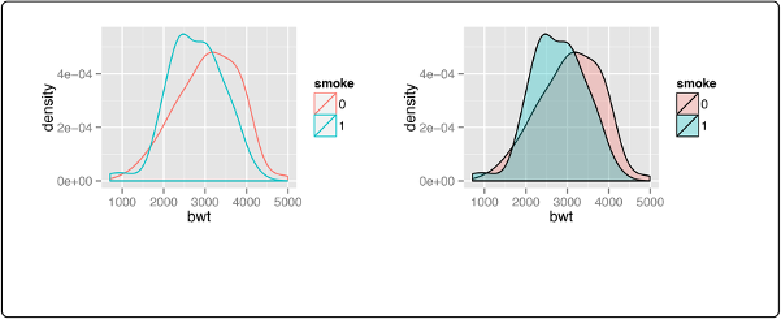
Figure 6-11. Left: different line colors for each group; right: different semitransparent fill colors
for each group
Discussion
To make these plots, the data must all be in one data frame, with one column containing a cat-
egorical variable used for grouping.
For this example, we used the
birthwt
data set. It contains data about birth weights and a num-
ber of risk factors for low birth weight:
birthwt