Graphics Reference
In-Depth Information
The
position="identity"
is important. Without it,
ggplot()
will stack the histogram bars
on top of each other vertically, making it much more difficult to see the distribution of each
group.
Making a Density Curve
Problem
You want to make a kernel density curve.
Solution
ggplot(faithful, aes(x
=
waiting))
+
geom_density()
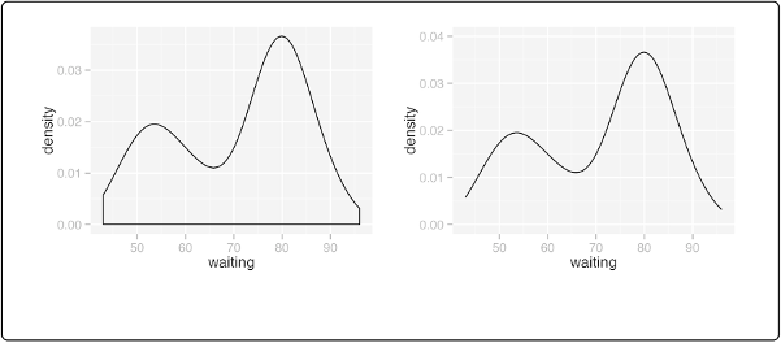
If you don't like the lines along the side and bottom, you can use
geom_line(stat="density")
(see
Figure 6-7
, right):
# The expand_limits() increases the y range to include the value 0
ggplot(faithful, aes(x
=
waiting))
+
geom_line(stat
=
"density"
)
+
expand_limits(y
=
0
)
Figure 6-7. Left: a kernel density estimate curve with geom_density(); right: with geom_line()
Discussion
Like
geom_histogram()
,
geom_density()
requires just one column from a data frame. For
this example, we'll use the
faithful
data set, which contains data about the Old Faithful geyser