Graphics Reference
In-Depth Information
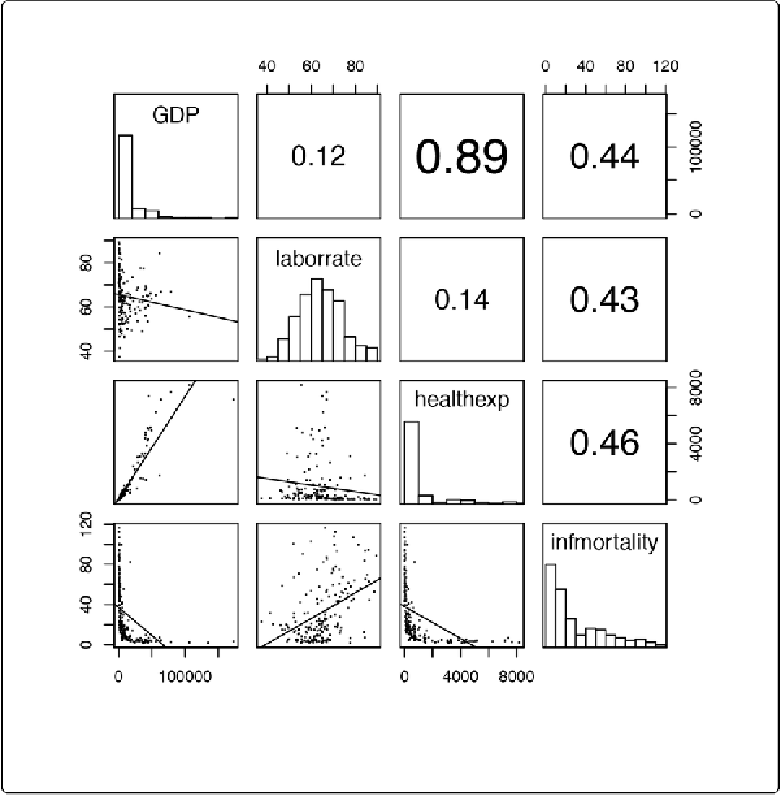
Figure 5-38. Scatter plot matrix with smaller points and linear fit lines
The size of the points can also be controlled using the
cex
parameter. The default value for
cex
is 1; make it smaller for smaller points and larger for larger points. Values below .5 might not
render properly with PDF output.
See Also
To create a correlation matrix, see
Making a Correlation Matrix
.