Graphics Reference
In-Depth Information
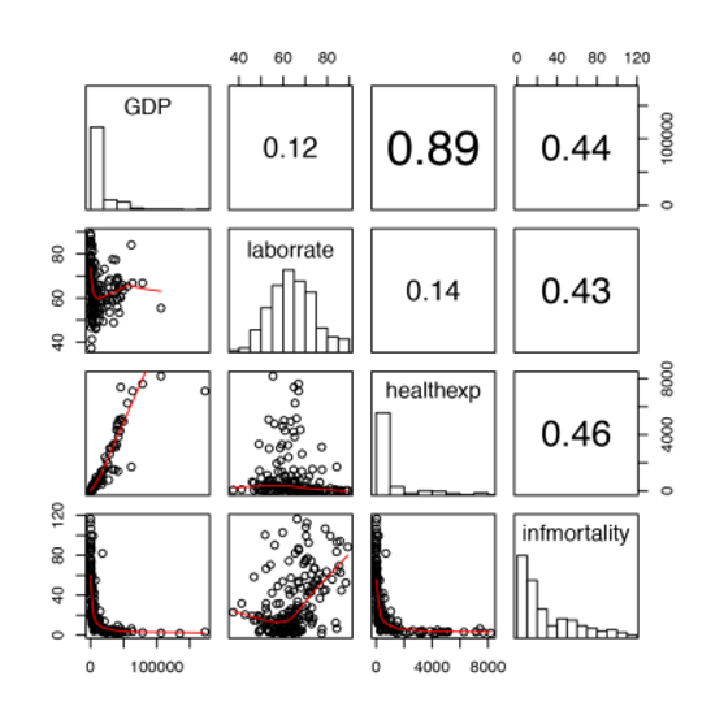
Figure 5-37. Scatter plot with correlations in the upper triangle, smoothing lines in the lower tri-
angle, and histograms on the diagonal
It may be more desirable to use linear regression lines instead of LOWESS lines. The
panel.lm
function will do the trick (unlike the previous panel functions, this one isn't in the
pairs
help
page):
panel.lm
<-
function
function
(x, y, col
=
par(
"col"
), bg
=
NNA
, pch
=
par(
"pch"
),
cex
=
1
, col.smooth
=
"black"
,
...
) {