Graphics Reference
In-Depth Information
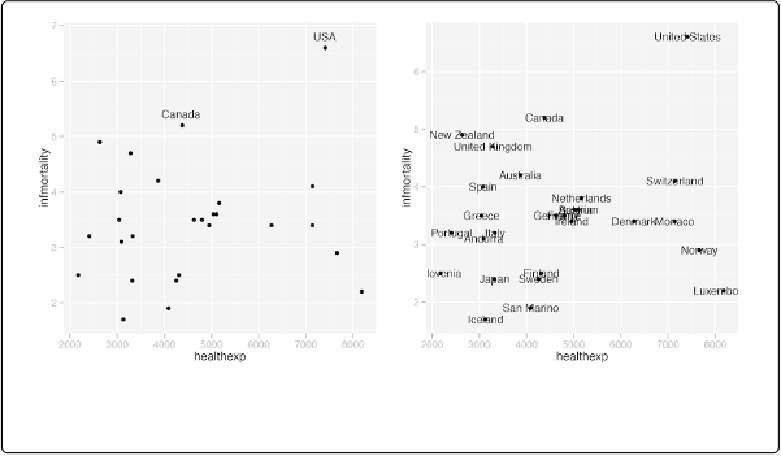
Figure 5-30. Left: a scatter plot with manually labeled points; right: with automatically labeled
points and a smaller font
a column that is a factor or character vector to the
label
aesthetic. In this case, we'll use
Name
,
and we'll make the font slightly smaller to reduce crowding. The default value for
size
is 5,
which doesn't correspond directly to a point size:
sp
+
geom_text(aes(label
=
Name), size
=
4
)
Discussion
The automatic method for placing annotations centers each annotation on the xand ycoordin-
ates. You'll probably want to shift the text vertically, horizontally, or both.
left), and setting
vjust=1
will make the top of the text level with the point. This usually isn't
enough, though—you can either increase or decrease
vjust
to shift the labels higher or lower,
right):
sp
+
geom_text(aes(label
=
Name), size
=
4
, vjust
=
0
)
# Add a little extra to y
sp
+
geom_text(aes(y
=
infmortality
+
.1
, label
=
Name), size
=
4
, vjust
=
0
)