Graphics Reference
In-Depth Information
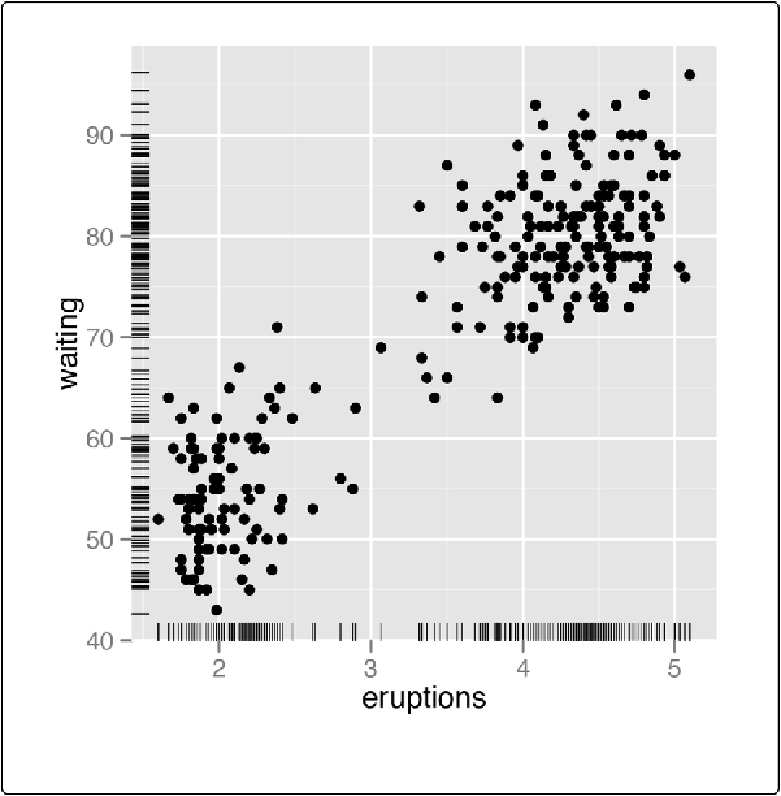
plotting. To reduce the overplotting, we can jitter the line positions and make them slightly thin-
ggplot(faithful, aes(x
=
eruptions, y
=
waiting))
+
geom_point()
+
geom_rug(position
=
"jitter"
, size
=
.2
)
Figure 5-29. Marginal rug with thinner, jittered lines