Graphics Reference
In-Depth Information
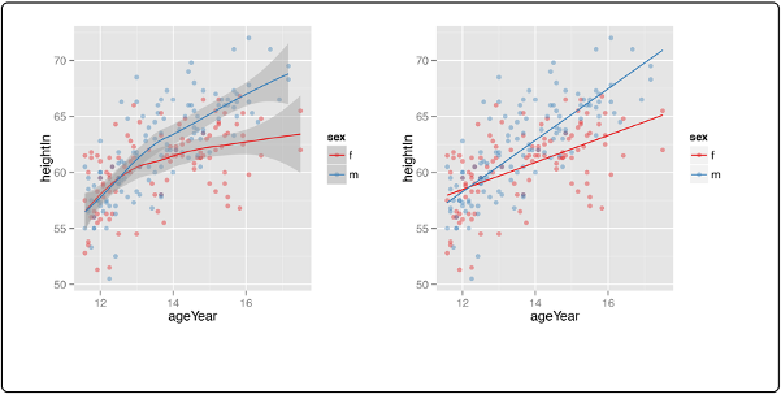
Figure 5-21. Left: LOESS fit lines for each group; right: extrapolated linear fit lines
Notice that the blue line, for males, doesn't run all the way to the right side of the graph. There
are two reasons for this. The first is that, by default,
stat_smooth()
limits the prediction to
within the range of the predictor data (on the x-axis). The second is that even if it extrapolates,
the
loess()
function only offers prediction within the xrange of the data.
If you want the lines to extrapolate from the data, as shown in the right-hand image of
stat_smooth()
the option
fullrange=TRUE
:
sps
+
geom_smooth(method
=
lm, se
=
FALSE
FALSE
, fullrange
=
TRUE
TRUE
)
In this example with the
heightweight
data set, the default settings for
stat_smooth()
(with
LOESS and no extrapolation) make more sense than the extrapolated linear predictions, because
we don't grow linearly and we don't grow forever.
Adding Fitted Lines from an Existing Model
Problem
You have already created a fitted regression model object for a data set, and you want to plot the
lines for that model.