Graphics Reference
In-Depth Information
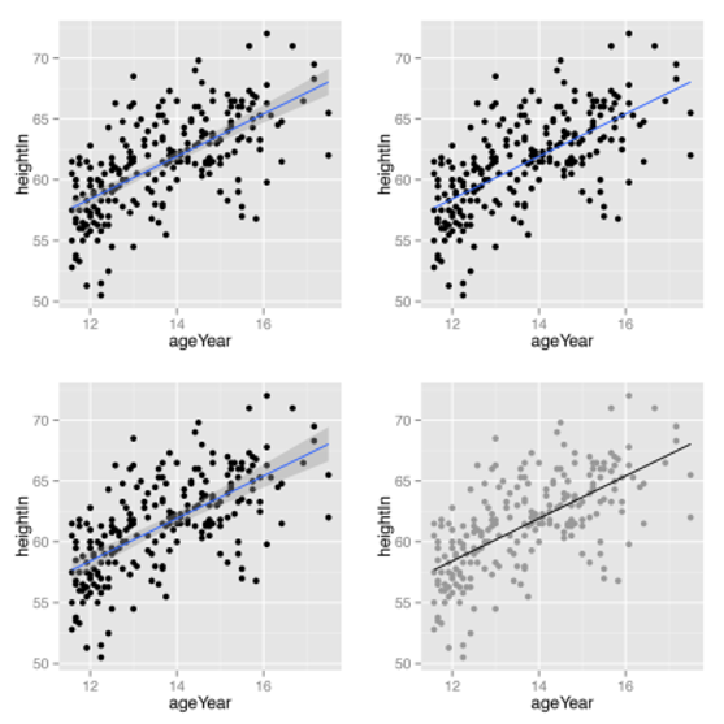
Figure 5-18. Top left: an lm fit with the default 95% confidence region; bottom left: a 99% confid-
ence region; top right: no confidence region; bottom right: in black with grey points
Discussion
The linear regression line is not the only way of fitting a model to the data—in fact, it's not
even the default. If you add
stat_smooth()
without specifying the method, it will use a
loess
(locally weighted polynomial) curve, as shown in
Figure 5-19
. Both of these will have the same
result: